The Equivalent Fiscal Pressure in Latin America and the Caribbean: Stylized facts and regional trends in the past decade
Developed as a result of the joint project conducted by the Inter-American Development Bank (IDB) and the Inter-American Center of Tax Administrations (CIAT), the Equivalent Fiscal Pressure (EFP) in Latin America and the Caribbean (LAC) is an attempt to measure, in a more accurate and comparable way, the fiscal burden in LAC countries i.e. the total resources raised along this region, which are generally underestimated using traditional methodologies. The EFP has four components:
The most recent update of this database, which covers the period 1990-2018 for a total of 25 countries, has allowed to check the continuation of an upward trend in the average level of fiscal pressure in LAC. Using the traditional methodology, LAC’s fiscal pressure[1], which includes only tax revenues and public social security contributions (SSCs), stood at 23.3% of GDP in 2018, a slight increase on the previous year (23.0% in 2017). Use of the EFP methodology adds 1.9 percentage points of GDP to the tax burden in 2018, bringing it to 25.2% of GDP, with an increase of 0.4 percent of GDP relative to 2017.
Figure 1. Equivalent Fiscal Pressure – Latin America and the Caribbean
Simple average of 25 countries (percentage of GDP)
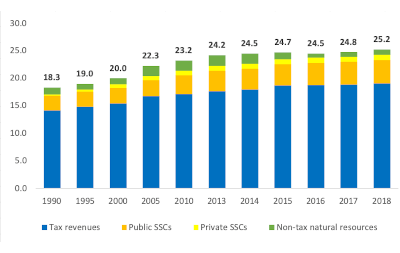
Source: prepared by the authors on the basis of data in the IDB-CIAT database.
This performance has rested fundamentally on the region’s three fiscal pillars: value added tax (VAT), income tax, and compulsory SSCs to public and private systems. In the past five-year period (2013–2018) the EFP grew by only 1.0% of GDP, equivalent to an increase of 4.1 percent. VAT and income tax grew by only 4.8 percent (7.3% of GDP in 2018) and 11.8 percent (6.3% of GDP), while revenues from natural resources declined by 51.9 percent (1.0% of GDP). However, among LAC’s subregions there are differences. Between 2013 and 2018, the Caribbean countries experienced the greatest increase in their traditional fiscal pressure (4.1 percentage points of GDP), while the other subregions all grew in the range of 0.5–1.4 points of GDP. As regards of EFP, the Caribbean experienced the most growth (3.0 percentage points of GDP), while the total tax burden fell by 0.9 points in the Andean Community and Venezuela. Noteworthy at the country level are the wide gaps in EFP levels. Cuba has the highest tax burden in the region (42.4% of GDP) and Guatemala has the lowest (11.8%). Analysis of the order of countries according to EFP levels, taking as a reference the most recent update to the database that took it to 2015, reveals that Bolivia, Trinidad and Tobago, Argentina and Paraguay dropped sharply on the regional ranking. By contrast, Uruguay made progress in consolidating its position as the country with the highest tax burden in Latin America (surpassed only by Cuba).
Analysis of the tax structures by country groups reveals similarities and differences depending on the tax being examined. As regards the “VAT” fiscal pillar, revenue varies among the countries. In the lead are the Caribbean (8.7% of GDP) and Mercosur, Chile and Mexico (8.3%). They are followed by the Andean Community (7.0%), and Central America and the Dominican Republic (5.4% of GDP). There are also marked differences in the area of income tax. In this category the Caribbean raises 8.0% of GDP, almost three points more than the Andean Community (5.2% of GDP and in last place in the region). As to public SSCs, Mercosur, Chile and Mexico have the most solid revenues in the framework of the public regime (5.3% of GDP) and the private system (1.9% of GDP). All the country groups derive revenue from natural resources; the Andean Community—not including Venezuela—was the subregion that raised most under this heading in 2018 (2.1% of GDP).
These gaps widen when the countries are analyzed separately. The highest revenue figures for the “VAT” fiscal pillar are for Cuba (18.5% of GDP), Brazil (12.5%), and Argentina (11.5%); the lowest figures are for Mexico (3.9% of GDP) and Panama (2.3%). With regard to income tax, Trinidad and Tobago raises 11.3% of GDP, followed by Cuba (10.3%), Guyana (9.9%) and Jamaica (8.7%). In 2018, public SSCs reached 10.1% of GDP in Uruguay and 8.4% in Brazil, while Peru raised just 2.0% of GDP. In private systems, Chile led the regional revenue rankings with 4.7% of GDP. As regards natural resources, 19 countries of the region receive non-tax fiscal revenues from this source. The countries that raised the most from natural resources in 2018 were Bolivia (4.5% of GDP), Mexico (4.2%), and Trinidad and Tobago (3.4%).
Figure 2. Fiscal Pillars and Non-Tax Revenues from Natural Resources, 2018
24 countries (percentage of GDP)
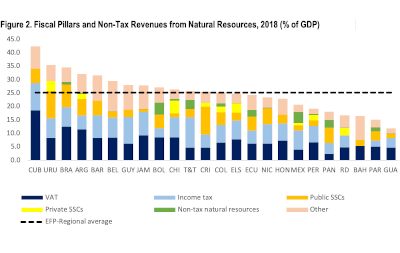 Source: prepared by the authors on the basis of data in the IDB-CIAT database.
For interested readers, all these data are now available in the CIATData website https://www.ciat.org/idb-ciat-revenue-collection-database/?lang=en), which detailed analysis can be found in the recent joint working paper of IDB and CIAT (2019) “Equivalent Fiscal Pressure in Latin America and the Caribbean: An analysis of the stylized facts in the past decade” (see: https://biblioteca.ciat.org/opac/book/5684).
[1] The regional and subregional averages exclude Venezuela for the most recent years (2016–2018) because of a lack of official data, as well as Ecuador (1990–92) and Nicaragua (1990). Given the lack of information, it has been assumed that the GDP data for Cuba in 2018 are equivalent to those recorded in 2017 (the last available year).
4,758 total views, 1 views today
3 comments
Very interesting paper. Could you kindly send a PDF copy so that I can read? Regards and thanks.
I was very interested in the paper. Could you kindly send a PDF copy so that I can read? Thanks.
Greetings,
Please find the paper in this link: https://biblioteca.ciat.org/opac/book/5684, and you may dowload any publication from CIAT, at CIAT Library https://biblioteca.ciat.org/opac/