Recovery signs? Revenue Report Covid-19 (RRC). 2021 First Quarter.

Link to Revenue Report Covid-19 (RRC). 2021 First Quarter.
After year 2020 in which revenue collection in constant values in the countries analyzed in the Report fell by an average of -9.3% (Excise Tax, -12.1%; Income Tax, IT -8.2%; VAT, -7.8%), although with significant heterogeneity by country (from -26.9% in Panama or -22.5% in Honduras, to +8.2% in Morocco , together with Mexico, +0.8, the only two that ended the year in positive), the monthly variations with respect to 2020 show spectacular growths in relation to the months of harsher confinement, above all, logically, in the taxes most hit by the social isolation measures. More importantly, with respect to 2019, the baseline scenario for assessing the recovery, the improvement in revenue collection is also observed, even though more modestly and not in all countries and tax categories.
With respect to 2020, the total accumulated collection increases by +13.6% up to April. By month, after stabilizing in January and February (periods compared to 2020 collection figures not yet affected by the pandemic), spectacular growth was recorded in March (+19.6%) and, above all, April (+46.6%), one of the most dramatic months of last year.
The comparison with 2019 allows us to qualify the extent of the recovery. On a monthly basis, the increases in January and February are logically higher than those corresponding to 2020, while in March and April (already affected by the pandemic), although growth is maintained, it is reduced to +10.9% and +2.1%, respectively. Cumulatively up to April there was an increase in collections of +4.3%, positive but decreasing since February.
Graph 0. Average evolution of cumulative tax collection by type of tax in 2021
(year-on-year changes – compared to 2020 and 2019 -; constant prices; in percentages)
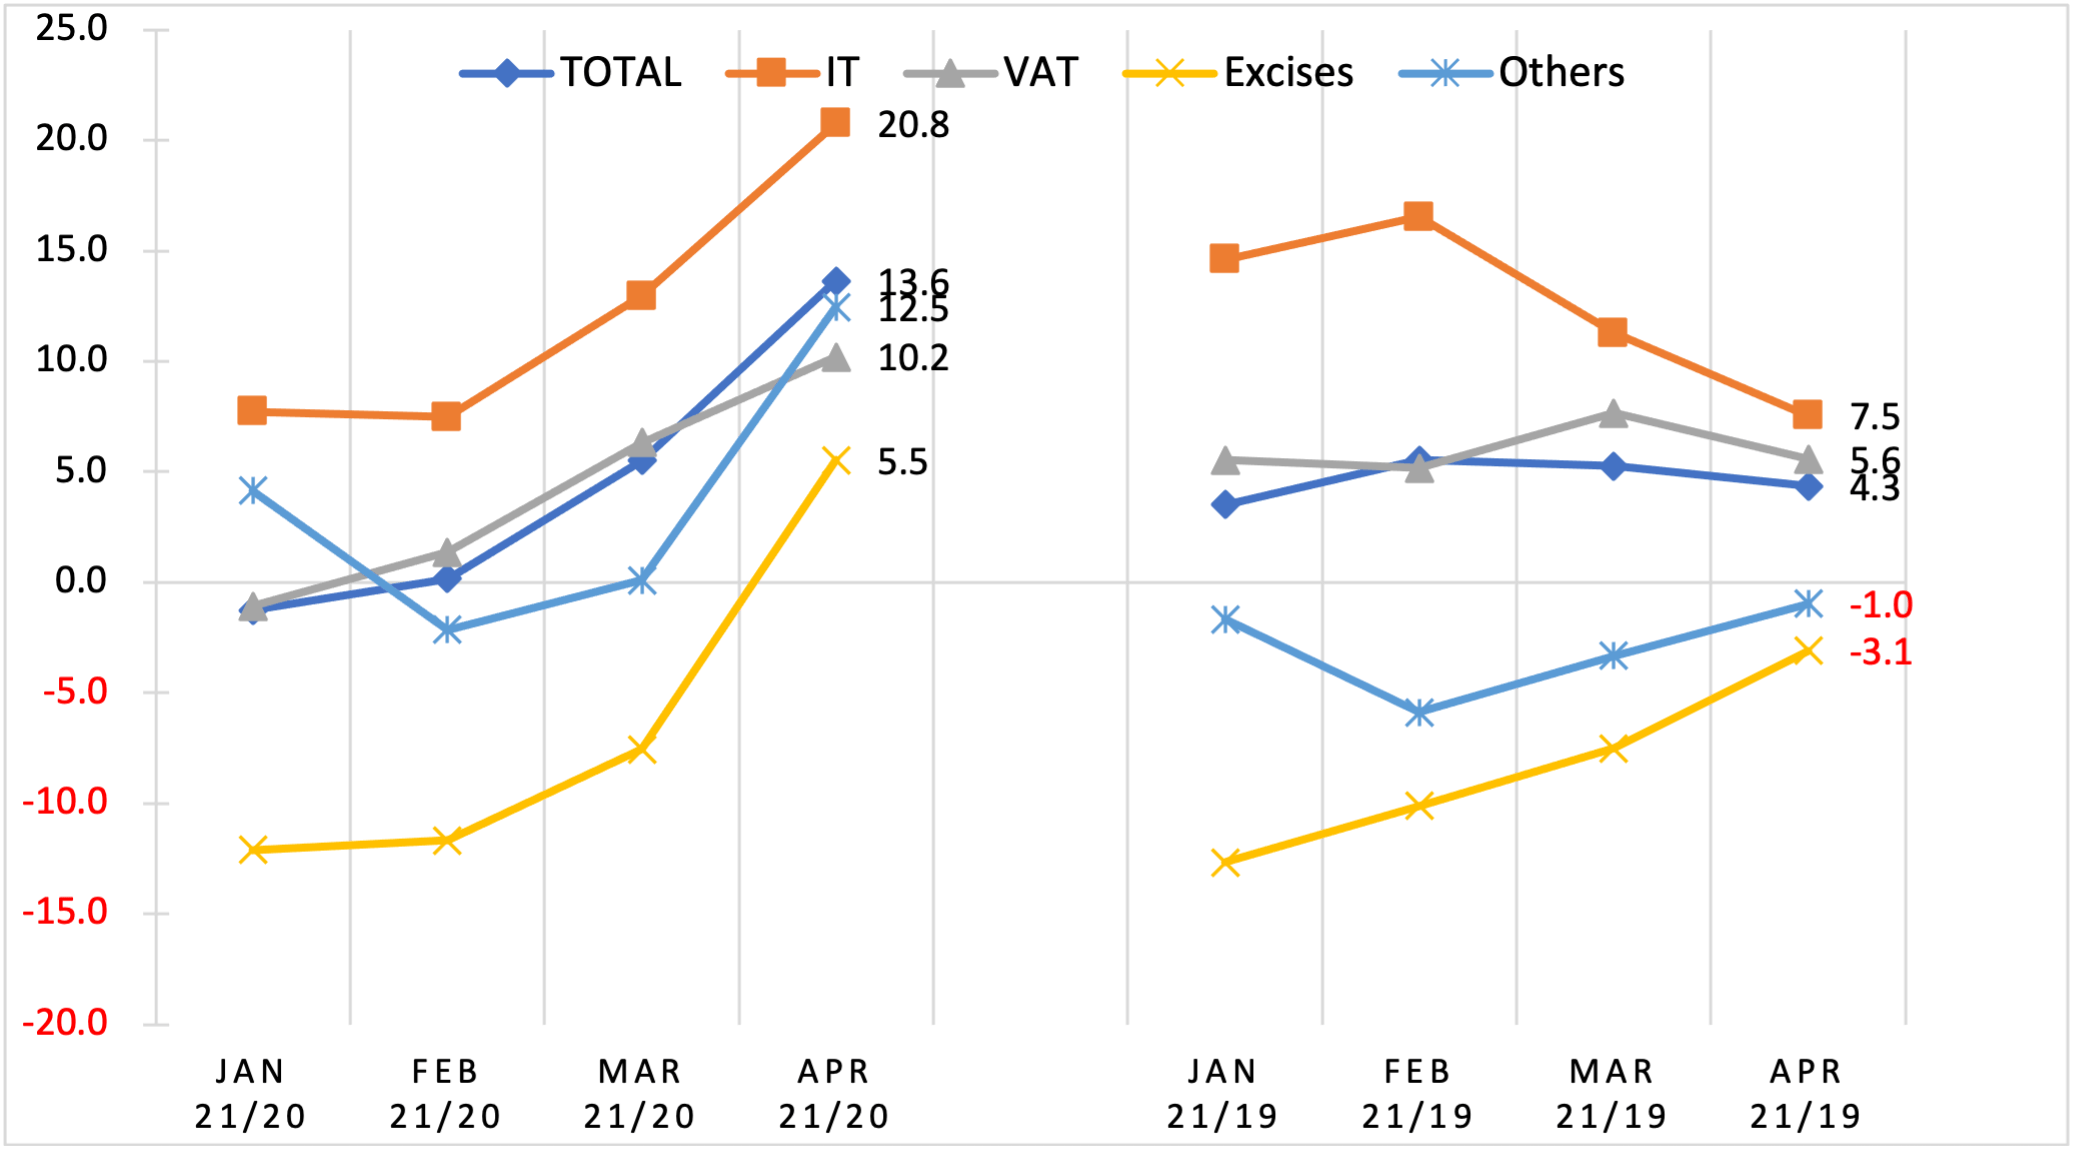
Source: Prepared by the authors based on official information from the tax administrations
Income tax (IT) collection is the one that increases the most of all the categories analyzed in cumulative terms up to April, +20.8% with respect to 2020 and +7.5% with respect to 2019.
Value Added Tax (VAT), continues in 2021 the positive trend shown in the last months of last year. The variation in VAT revenue is the most aligned with that of the overall collection, increasing in cumulative terms up to April by +10.2% with respect to 2020 and +5.6% with respect to 2019.
In the first months of the year 2021, the collection of Excise Taxes continues to be the most impacted by the crisis. With respect to 2020 up to April, its accumulated average collection is the one that increases the least (+5.5%) despite registering in that month the highest monthly increase (+60.3%). With respect to 2019, the accumulated collection up to April is still in negative territory (-2.9%) and most of the months the variations are still negative.
To contrast the effects of the activity control measures implemented in the fight against the pandemic, this Report uses mobility data provided by Google, which provide the possibility of inferring or anticipating, at least to some extent, the prospects for the evolution of tax revenues. Previous editions of the RRC have already analyzed the correlation between mobility and tax collection, both in average values and by means of a panel data analysis. However, this relationship was not stable throughout the year, being much stronger until June, while from the middle to the end of the year the relationship between variations in mobility and total revenue became somewhat more diffuse. Incorporating the data for the first four months of 2021 confirms the loss of explanatory power, especially when isolating the behavior between July 2020 and the present.
Finally, the last section provides an overview by groups of selected countries, according to generally accepted geographic-economic criteria. In cumulative values, the Central America+DR region leads the recovery with respect to 2020, closely followed by the rest (except the Caribbean), while in relation to 2019 it is the non-Latin American countries (Other countries) that register a stronger and more stable recovery (+13, 1% up to April), followed by Central America+DR (+5.6%), Mercosur+Mexico (+4.2%) and the LAC average (+3%), while Andeans+Chile (-1.5%) and Caribbean countries -(-3.5%) show negative figures.
The CIAT web page (Collection | Inter-American Center of Tax Administrations (ciat.org) “Monthly Collection Database (Annex)”) provides additional detailed information on the monthly and cumulative evolution -in constant and current values- of all the tax administrations analyzed.
2,488 total views, 4 views today