Revenue Report COVID-19

Closing this unfortunate 2020 is a good time to gather the available information regarding the evolution of the tax revenue, collected in the recently published Revenue Report COVID-19 (RRC) of CIAT. This third edition of the RRC analyzes the data available for the January-September 2020 period and incorporates information from an additional country (Jamaica) to the twenty-one CIAT members already contained in the database.
The Global collection fell monthly (compared to the same month of the previous year) from March, when most countries began to implement various containment measures. After meager increases in constant values during the first two months of the year, in March the average global revenue decreased by 4.9% year-on-year, with deeper declines in April (-29.9%), in May (-27.6%), and in June (-22.3%). Since July, there has been a strong rebound in the average global revenue, which, while remaining in negative territory, reduced its relative monthly falls to -3.9% in that month, -7.5% in August, and -3.4% in September. At the country level, while last May all the countries surveyed showed strong year-on-year decreases, in September, 9 of the 20 countries with available information already show monthly increases compared to the same month of 2019.
In terms of global accumulated collection up to September of the current year (Graph 0), the simple average for the countries surveyed has followed a pattern clearly descending from the positive data of the first quarter (4.2% in January, 3.3% in February, and 0.03% in March) to get into negative territory from April (-9,3%), accentuating their fall year-on-year cumulative to June (-14.3%) and recovering slightly during the last quarter to reach -11.1% in the month of September. At the country level, the largest cumulative falls until September are observed in Bolivia (-34.7% until July), Panama (-30.9%), Honduras (-25.7%), and Peru (-18.1%). While some countries (Colombia, Guatemala, Italy, and Mexico) have shown a decline in cumulative changes compared to the values recorded in June, the vast majority of countries have shown a mitigation in cumulative reductions, even though all countries-except Morocco – remain in negative territory.
The Income Tax (IT) had shown, on average, repeated decreases in collection between the months of March and June, while the month of July appears as a turning point that has changed it into the main support and driver of the recovery observed in the last quarter in global collection. On average, year-on-year increases of 9.7 % were recorded in July, 1.2 % in August and 2.4 % in September. To a large extent, this is linked to the arrival, during the most recent quarter, of resources whose collection had been subject to the postponement or extension of tax deadlines. By countries, the most significant spikes during the last quarter appear in the U.S. (+225.0% in July), Panama (+85.5% in July), Paraguay (+68.0% in August and +36.6% in September), Honduras (+31.8% in August), Ecuador (+72.1% in September) and El Salvador (+33.8% in September).
The Value Added Tax (VAT), after the sharp fall in May (-30.2%), shows more limited year-on-year decreases in the following months, reaching an average of -17.5% in June, -14.8% in July, -11.5% in August, and -6.9% in September, all compared to the same month last year. At the country level, the high heterogeneity of cases remains, but there is a clear trend towards recovery, at least with respect to the deep declines in April and May. In cumulative values, the decrease in VAT revenue (-12.6%) is aligned with that of global revenue (figure 0). The cumulative declines in Bolivia (-42.4% until July), Panama (-39.6%), Honduras (-22.8%), Ecuador (-21.4%), and Peru (-19.3%) stand out. In the opposite direction, we can mention the cases of Morocco (+3.4%), Trinidad and Tobago (+11.6% until July), Paraguay (-1.1%), Mexico (-2.0%), Uruguay (-3.1%) and Brazil (-3.6% for the subnational ICMS).
Excise Taxes have recorded the biggest monthly falls in the collection, reaching -37.9% in April, -41.2% in May and -29.9% in June. As of July, the annual collection of Excise Taxes shows a recovery but continuing in negative territory (-15.5% in July; -14.6% in August and -8.4% in September). In cumulative terms until September, the average collection still recorded declines similar to those observed in May, which are of greater magnitude (negative) compared to the evolution of revenue from the other taxes analyzed. As for the countries, Panama continues to show the largest decline in accumulated revenue (-43.8% until September), followed by Colombia (-34.6%) and Italy (-30.0%).
Graph 0. Evolution of cumulative average global collection (year-on-year changes; constant prices; in percentages)
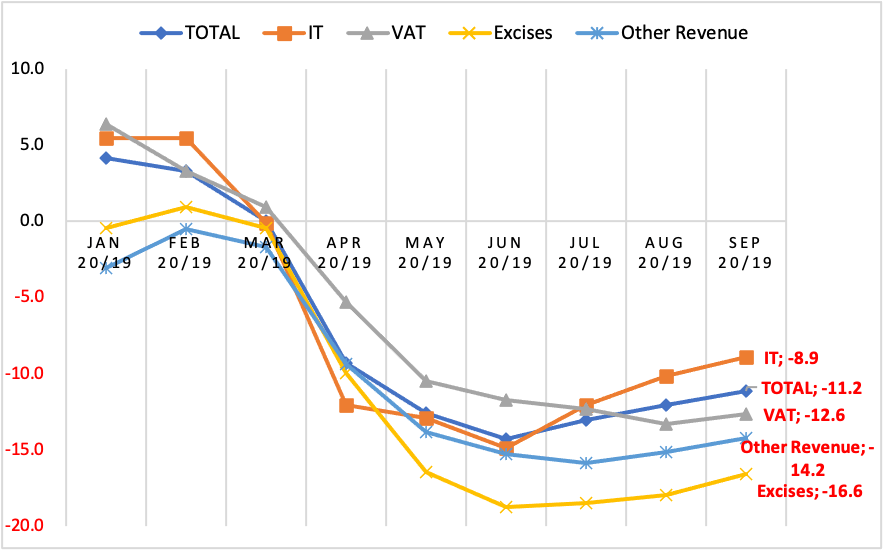
Source: Author’s elaboration based on official information from tax administrations
In addition, to compare the effects of the measures of control activity deployed in the fight against the pandemic, in this Report, we use the data of mobility provided by Google, which give the possibility to infer, or anticipate, at least in an approximate way, the perspectives of evolution of the tax revenues for the following months, especially after the emergence of a “second wave” of infections in various countries that have been forced to reset several containment measures that resulted in a reduction of the levels of mobility.
Finally, the last section of the RRC provides an overview by selected groups of countries, according to geographical-economic criteria, in which both similarities and clear differences are observed, with the Andean, Caribbean and, especially, Central American countries particularly affected by the contracting effects of the pandemic. Its evolution contrasts with that of the Mercosur countries (including in this group Mexico for its behavior) and other countries (USA, Europe, Africa), whose average total revenue was more resilient during the first quarter, with more vigorous and sustained recoveries from May and June and moving to positive year-on-year variations from August.
On the CIAT website, you can access the full report (Revenue Report COVID-19), as well as the “monthly collection database (annex)” that offers additional detailed information on the monthly and cumulative evolution-in constant and current values – of all the tax administrations analyzed.
3,146 total views, 3 views today